
Ether ‘Triangle’ Shows $227 Billion Cryptocurrency Is Poised For A Big Change
Followers of technical analysis should look at ether’s daily chart today, which shows the cryptocurrency that popularized smart contracts could soon exit what’s known as a triangular consolidation in favor of a strong directional move upward.
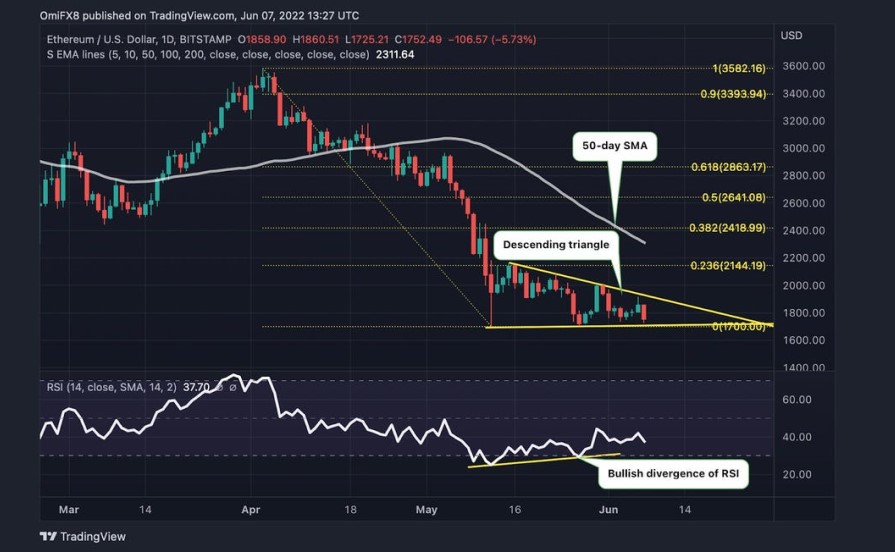
Simply put, since May 12, ether, the second-largest cryptocurrency, valued at $227 billion, has traded in an extremely tight range, with downside restricted around $1,700 and several shallow price bounces, marking bull failure between $2,000 and $2,150.
In other words, the cryptocurrency has formed a descending triangle on charts identified by trendlines connecting lower price highs (shallow price bounces) and horizontal support, in this case at $1,700.
Created in 2015 ethereum is best known as the first blockchain that let software developers write any number of sophisticated operations, called smart contracts. As of today, eight of the top 20 cryptocurrencies by market cap are so-called Ethereum-Killers, smaller competitors trying to build more efficient alternatives.
A UTC close above the upper end of the triangle would confirm a breakout and imply a bearish-to-bullish trend change, opening doors to the resistance of the 50-day simple moving average (SMA), currently at $2,338 and $2418, the 38.2% Fibonacci retracement of the sell-off from the April high to May low.
Ether, however, traded under pressure at press time and appeared on track to test the lower end of the triangle at $1,700. A UTC close below would signal a continuation of the broader bearish trend and shift the focus to deeper support at $1,420, the price at which ether peaked in January 2018.
Want more like this? Click here to subscribe to the Forbes CryptoAsset & Blockchain Advisor
Whether the triangle ends with a bullish breakout or bearish breakdown is anybody’s guess. That said, the relative strength index’s bullish divergence and past week’s Doji candle suggest downtrend exhaustion. Therefore, a breakout looks likely.
An RSI is a popular technical indicator to gauge overbought and oversold conditions. A bullish or positive RSI divergence occurs when the indicator forms a higher low even as the asset tests or falls below its recent price low, as happened in the ether market last month.
While ether dropped to $1,700 on May 12 and May 27, the cryptocurrency’s late May slide to the psychological support saw RSI bottom out higher than on May 12. The divergence indicates the downtrend has lost steam.